Drone Crop Health Monitoring: A 2026 Guide
Table of Contents
- What Drone Crop Health Monitoring Does
- Multispectral Sensor for Agriculture: Capturing Plant Health Data
- NDVI Crop Health Analysis: Measuring Vegetation Stress
- Real-Time Data Analysis and Precision Agriculture Integration
- FAA Part 107 Agricultural Operations: Legal Compliance
- Building Your Drone Monitoring Workflow
- Calculating ROI: From Cost to Crop Improvement
- Conclusion
Last Updated: August 17, 2026
What Drone Crop Health Monitoring Does
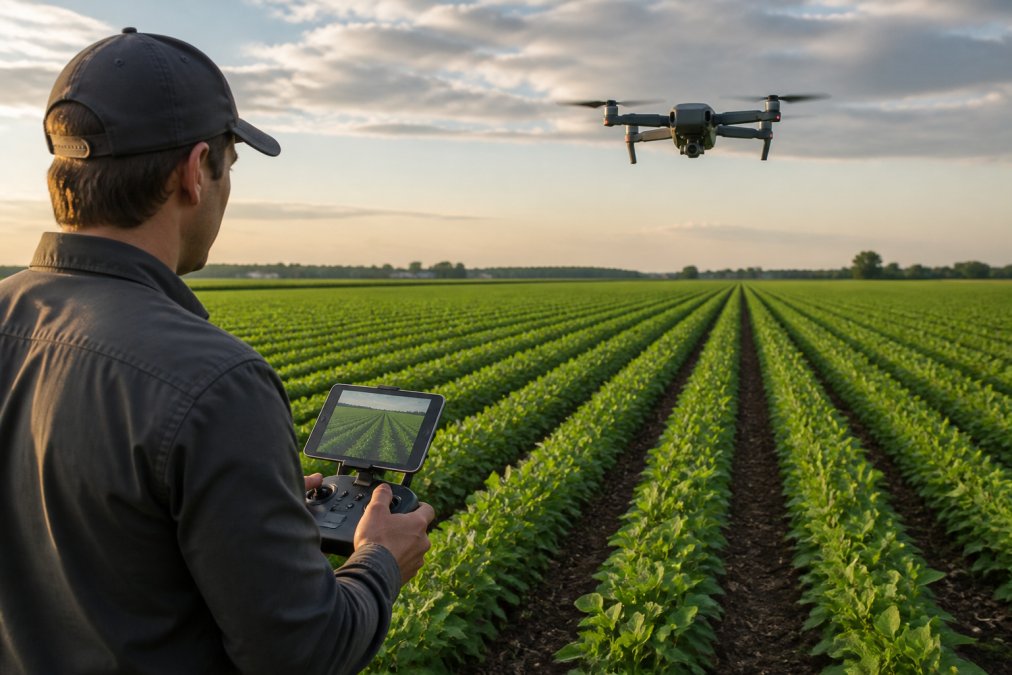
Drone crop health monitoring uses aerial imaging and advanced sensors to assess plant condition, detect stress, and optimize farming decisions in real time. Farmers deploy drones equipped with multispectral, thermal, or RGB cameras to capture detailed data across entire fields in minutes, revealing patterns invisible to the naked eye: nutrient deficiencies show as color shifts, water stress appears as temperature variations, and pest or disease pressure becomes evident through biomass loss. When integrated with farm management software and geospatial analysis tools, this data feeds directly into variable rate application decisions, irrigation scheduling, and harvest planning.
At Airborne Assets LLC, we understand that agricultural operations depend on actionable intelligence. Drone-based monitoring delivers that intelligence at scale, turning raw aerial imagery into agronomic insights that drive profitability.
Multispectral Sensor for Agriculture: Capturing Plant Health Data
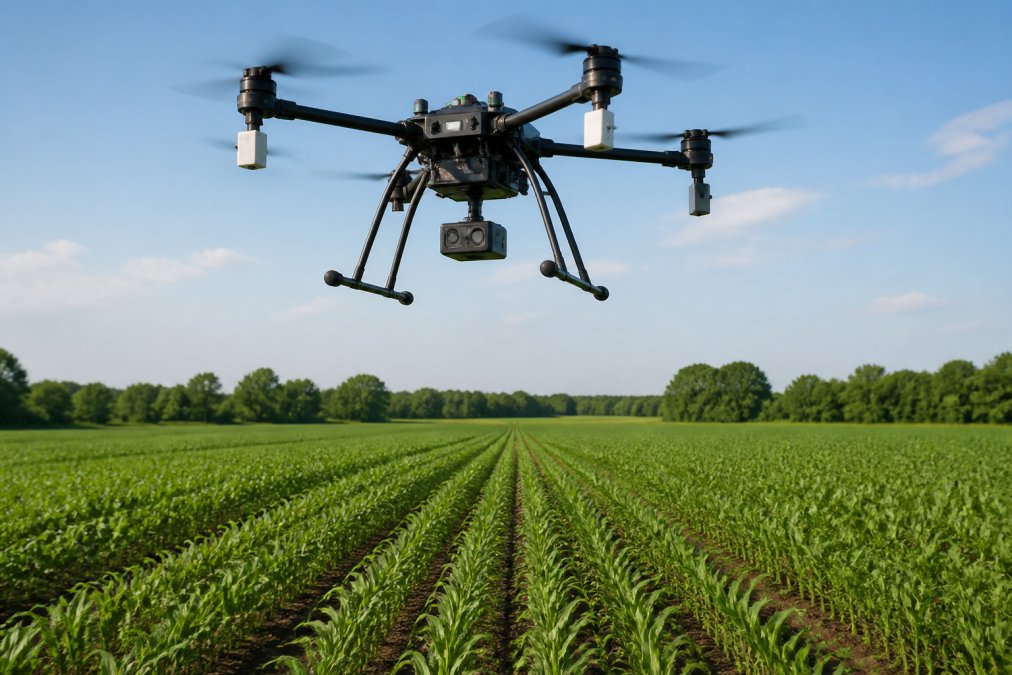
Multispectral sensors are the backbone of precision agriculture. These cameras capture light across multiple wavelengths, typically visible red, green, blue, and near-infrared bands, allowing farmers to measure vegetation health metrics that single-band RGB cameras cannot detect.
How Multispectral Sensors Work
Multispectral imaging isolates specific wavelengths of light reflected from plants. Healthy vegetation reflects strongly in the near-infrared spectrum while absorbing visible red light for photosynthesis. A multispectral sensor captures these reflectance patterns across multiple bands simultaneously, creating a dataset that agronomists can analyze to calculate vegetation indices and assess crop condition.
Most agricultural multispectral systems include red (620-750 nm), green (500-600 nm), blue (400-500 nm), and near-infrared (750-1100 nm) bands. Some advanced systems add red-edge bands (705-745 nm) for finer detection of early stress. When the drone flies at consistent altitude and speed, the sensor collects georeferenced data, each pixel tagged with GPS coordinates, making it possible to map field variation and track changes over time.
RGB, Thermal, and Hyperspectral Options
RGB cameras capture visible light in three bands and excel at visual documentation, but lack the spectral depth to quantify plant stress accurately. Thermal sensors measure infrared radiation emitted by objects, revealing temperature differences across the field. Cooler crops indicate better water availability; warmer areas suggest water stress. Thermal imaging is particularly valuable for irrigation management because plant temperature correlates strongly with soil moisture status.
Hyperspectral sensors capture hundreds of narrow spectral bands, offering extreme detail and detecting subtle stress indicators before multispectral systems identify them. However, hyperspectral data is computationally intensive and costs significantly more. For most agricultural operations, multispectral provides the best balance of information density, processing speed, and cost efficiency.
NDVI Crop Health Analysis: Measuring Vegetation Stress
NDVI (Normalized Difference Vegetation Index) is a standardized calculation that quantifies vegetation health using the contrast between red and near-infrared reflectance. The formula is: (NIR − Red) / (NIR + Red). Values range from −1 to +1, with higher values indicating healthier, denser vegetation.
What NDVI Reveals About Plant Condition
An NDVI value above 0.6 typically indicates vigorous, healthy vegetation. Values between 0.4 and 0.6 suggest moderate growth or stress. Values below 0.4 signal significant stress, poor establishment, or non-vegetated areas. By mapping NDVI across a field, managers identify problem zones immediately.
NDVI doesn't directly measure water, nutrients, or disease, but reflects the plant's overall response to all stressors. Comparing NDVI across multiple flight dates reveals growth trends. Rising NDVI week-to-week indicates recovery or vigorous growth; declining NDVI signals deterioration and demands immediate investigation.
Using NDVI for Early Disease and Pest Detection
Disease and pest pressure often appear in NDVI maps before visible symptoms emerge. Fungal infections, bacterial wilts, and insect damage all disrupt photosynthesis and nutrient transport, causing localized NDVI depression. A circular or patch-like NDVI anomaly may indicate disease center or pest colony. Early detection allows targeted scouting and intervention, reducing chemical use while protecting yield.
The spatial resolution of drone imagery (typically 1-5 cm per pixel) is fine enough to detect individual plant stress in row crops and identify specific plants affected by disease in tree crops, enabling variable rate fungicide or insecticide application.
Real-Time Data Analysis and Precision Agriculture Integration
Raw drone imagery becomes actionable insight only when processed and connected to farm management systems. Real-time data analysis means processing flight data within hours, allowing managers to make decisions while conditions are still developing.
Processing Geospatial Data for Actionable Insights
Post-flight processing begins with orthomosaic mapping: stitching individual drone images into a seamless, georeferenced map. Specialized software aligns overlapping images, corrects for camera angle and altitude variation, and outputs a single coherent map with GPS accuracy.
Next, the processing pipeline calculates vegetation indices (NDVI, GNDVI, NDRE, and others) by applying mathematical formulas to the multispectral bands. Software generates index maps showing spatial variation, highlights anomalies, and compares current maps to historical baselines. Many platforms include automated anomaly detection that flags areas exceeding user-defined stress thresholds.
The final step translates spatial analysis into management zones. Software can cluster similar NDVI values into management units, define prescription boundaries for variable rate application, or generate irrigation zone recommendations.
Connecting Drone Data to Farm Management Software
Farm management software (FMS) platforms like John Deere Operations Center, AgWorld, and Granular serve as the operational hub for field data. Connecting drone imagery and NDVI maps to these systems creates a unified decision-support environment. Many FMS platforms accept geospatial data in standard formats (GeoTIFF, shapefiles, KML) that drone processing software outputs. Once imported, NDVI maps can inform variable rate prescriptions for fertilizer, fungicide, or irrigation.
Data integration with farm management software multiplies the value of drone crop health monitoring, enabling trend analysis across seasons and supporting long-term soil health and crop rotation decisions.
FAA Part 107 Agricultural Operations: Legal Compliance
Flying drones over agricultural land requires FAA Part 107 certification for the pilot. Part 107 establishes operational rules for all commercial drone operations; violations carry fines up to $27,500 and potential criminal penalties.
Key Part 107 requirements include: the pilot must maintain visual line of sight with the aircraft, flights must occur during daylight hours, the drone cannot exceed 55 mph ground speed, maximum altitude is 400 feet above ground level, and operations must stay clear of populated areas. Agricultural fields typically meet these requirements, but operations near buildings, roads, or neighboring properties require careful planning.
Part 107 also requires airspace authorization for flights in controlled airspace near airports or military installations. Check the airspace classification using the FAA's B4UFLY app or contact the local Flight Service Station before flying.
CALL Clear Focus Imaging TODAY →
Liability insurance is essential. Standard Part 107 operations require at least $100,000 in liability coverage; agricultural operations often require higher limits. Work with an insurance broker experienced in drone operations to ensure adequate coverage.
Building Your Drone Monitoring Workflow
A successful drone crop health monitoring program requires coordination across flight planning, data capture, processing, and decision implementation.
Flight Planning and Autonomous Paths
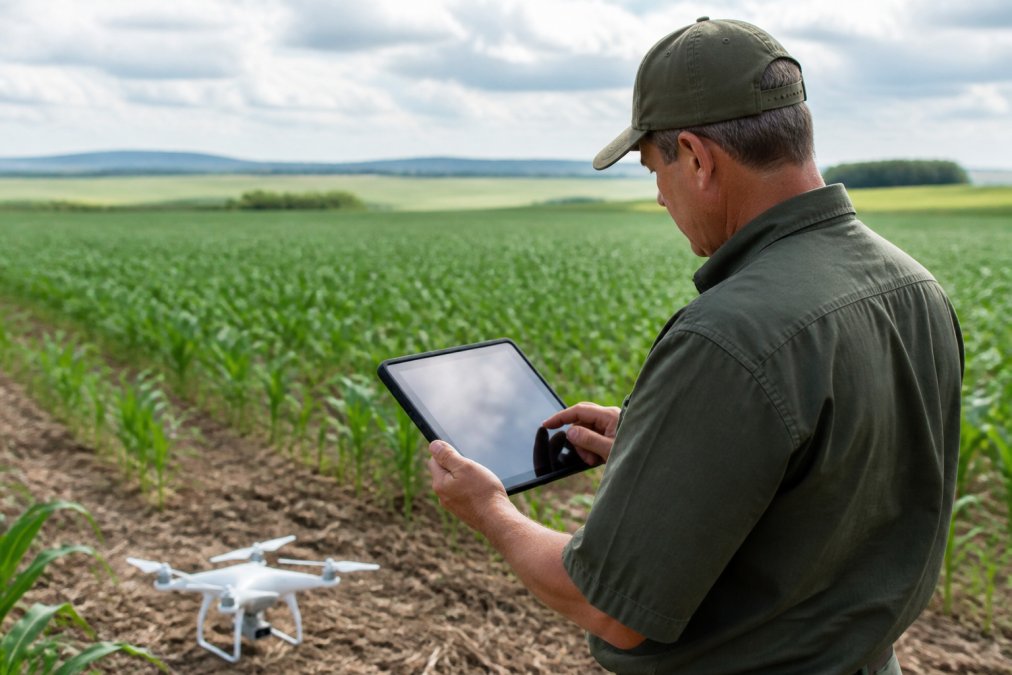
Flight planning software (such as DroneDeploy, Pix4D, or Agribotix) allows pilots to define autonomous flight paths before launch. The operator sets waypoints, altitude, camera overlap, and flight speed; the software calculates the path and downloads it to the drone. Autonomous flights ensure consistent image overlap (typically 75-80% forward and 60% side overlap for multispectral work), which is critical for accurate orthomosaic stitching.
For multispectral imaging, consistent altitude is essential because pixel size depends directly on flight height. Flying at 250 feet above ground level yields approximately 1 cm per pixel resolution. Flight timing matters: early morning flights, when shadows are minimal and dew has cleared, produce the best multispectral data. Flights on clear, cloudless days yield cleaner reflectance data than overcast conditions.
Post-Processing and Orthomosaic Mapping
After landing, the drone's memory card contains hundreds of individual images. Processing software ingests these images, applies radiometric calibration, and stitches them into a georeferenced orthomosaic. This step typically takes 1-4 hours depending on image count and processing power.
Once the orthomosaic is generated, the software calculates vegetation indices. NDVI is the most common, but many systems also compute GNDVI, NDRE, and others. Quality control is critical: operators should visually inspect orthomosaics for stitching errors, gaps, or radiometric inconsistencies, and compare current NDVI maps to historical baselines to identify processing artifacts versus real field variation.
Soil Moisture, Irrigation, and Yield Forecasting
Thermal imaging and NDVI data inform irrigation scheduling. Cooler plant canopies indicate adequate soil moisture; warmer canopies suggest water stress. By mapping canopy temperature across the field, managers identify irrigation zones that need water sooner than others, reducing water waste and maintaining more uniform crop growth.
NDVI trends predict yield. Fields with consistently high NDVI throughout the growing season typically yield better than fields with declining NDVI. By monitoring NDVI at key growth stages, managers can forecast end-of-season yield and adjust harvest planning accordingly. Soil moisture mapping enables precision irrigation scheduling: managers apply water when soil moisture in specific management zones drops below a threshold, reducing water use, lowering energy costs, and maintaining crop quality.
Calculating ROI: From Cost to Crop Improvement
The return on investment from drone crop health monitoring depends on farm size, current yield levels, and the specific problems the technology addresses.
Direct cost factors include drone hardware (multispectral-equipped drones range from $15,000 to $50,000+), processing software subscriptions ($500-$3,000 annually), pilot training and certification ($1,000-$2,500), and insurance ($500-$2,000 annually). Labor for flight planning, data processing, and analysis adds 10-20 hours per season.
Benefits accrue from improved decision-making. Early disease detection prevents crop loss; catching a fungal outbreak two weeks early might save 10-15% yield in affected zones. Precision irrigation reduces water use by 10-20% while maintaining yield. Variable rate fertilizer application reduces input costs by 5-10% without sacrificing yield.
For a 500-acre corn or soybean operation, realistic annual benefits include: disease/pest detection preventing 5-10% yield loss on 50-100 acres ($1,500-$3,000 value), irrigation optimization saving 10% water and energy on 200 irrigated acres ($2,000-$4,000 value), and precision input application saving 5-10% on variable costs across 300 acres ($1,500-$3,000 value). Total annual benefit: $5,000-$10,000. Against annual costs of $3,000-$5,000, the payback period is typically 6-18 months for mid-sized operations.
Larger operations (1,000+ acres) see faster payback because fixed costs are distributed across more acres. Smaller operations (under 200 acres) may find the ROI timeline longer unless they specialize in high-value crops where yield and quality premiums justify the investment.
Drone crop health monitoring delivers real value when integrated into a complete agronomic system. The technology, multispectral sensors, NDVI analysis, thermal imaging, is mature and reliable. The opportunity lies in translating data into decisions that improve profitability and sustainability.
Airborne Assets LLC specializes in custom aerial solutions that work within your existing farm operations. Whether you're documenting field conditions for precision agriculture integration, conducting regular crop health assessments, or planning irrigation and input application, professional drone monitoring provides the spatial data and temporal frequency that ground-based scouting cannot match. Contact Clear Focus Imaging today for a free consultation to discuss how drone crop health monitoring can support your operation's goals.
Frequently Asked Questions
How can drones be used to monitor crop health?
Agricultural drones equipped with multispectral sensors capture detailed imagery of crop fields that reveals plant stress, disease, and pest damage invisible to the naked eye. The drone collects data across multiple light wavelengths, which is processed using NDVI analysis to generate maps showing vegetation health across your entire field. This real-time monitoring enables early intervention before problems spread, reducing losses and improving yield.
What sensors are required for effective crop health monitoring?
Multispectral sensors are the primary tool, capturing data in red, green, blue, and near-infrared bands to calculate NDVI and assess plant stress. Thermal sensors detect temperature variations that indicate irrigation problems or disease hotspots. Some operations also use hyperspectral sensors for more detailed crop composition analysis. RGB cameras provide visual context. The right sensor depends on your specific crops, field size, and monitoring goals.
What are the FAA regulations for agricultural drone operations?
The FAA Part 107 regulations govern all commercial drone flights, including agricultural monitoring. You must hold a Part 107 remote pilot certificate, keep drones within visual line of sight, fly during daylight, maintain altitude limits, and follow airspace restrictions. Agricultural operations over private farmland have fewer restrictions than urban areas, but compliance is mandatory. Hiring a certified pilot or obtaining your own certification ensures legal operation and protects your liability.
How does multispectral imaging improve crop yield predictions?
Multispectral imaging captures plant health data throughout the growing season, allowing you to track chlorophyll content, canopy cover, and biomass development. This data feeds into yield estimation models that predict harvest output weeks before harvest. Early visibility into expected yields lets you adjust marketing, storage, and logistics plans. Combined with soil moisture mapping and growth pattern analysis, multispectral data significantly improves forecast accuracy compared to visual field scouting alone.
How much does professional drone crop monitoring service cost?
Pricing depends on field size, flight frequency, sensor type, and post-processing requirements. Professional services typically charge per acre or per flight mission. For accurate pricing tailored to your operation, contact a certified agricultural drone service provider who can assess your specific needs. Many operators offer seasonal packages or discounted rates for multiple flights, and some include farm management software integration in their service bundles.
Do farmers use drones to monitor crops?
Yes, agricultural drones are increasingly adopted by farmers of all sizes for crop health monitoring, disease detection, and yield optimization. The technology provides a cost-effective alternative to manned aircraft or satellite imagery, with faster turnaround and higher resolution. Farmers use drone data to make variable rate application decisions, identify irrigation inefficiencies, and plan targeted interventions, resulting in measurable improvements in yield and reduced input costs.
This article was written using GrandRanker
